Friday 28 May 2010

gvSIG, I want to love you...

I've just been proofreading an article on gvSIG for the next OSgeo Journal (Volume 6, coming to an HTTP server near you soon). And I so want to love it. The author claims it does everything for him. I want it to do everything for me too.

Currently I use QGis for my day-to-day GIS operations. But the limitations are there - mostly in the geoprocessing arena. Vector and raster operations are a bit fragile and buggy at the moment, mostly because they are fairly new to QGis. A grand effort by Carson Farmer et al has greatly increased the analytical capabilities of QGis but there is still a way to go. Meanwhile gvSIG, with the Sextante toolbox, has it all. At least in theory. Time for me to try it out again.

So, off to the web site, and download the latest version. Its a Java app, and I keep getting bitten by incompatible Java environments so I downloaded the version for Linux with the included JRE. It's a big .bin file, so once downloaded you chmod it executable and run it. Choose an install directory and components, and there it goes. All ready to run. 

First thing I notice is that the java environment doesn't resize properly. No matter how I stretch or refresh the window, the blue desktop remains fixed size. The grey area is unusable:


Oh well never mind, let's have a look at the interface:
yes, well peace to you too. This menu has one option concerning DBF file encodings. I went 'huh?' and tried something else. Let's load a shapefile.

First you have to create a new "View", so click on the View icon and there's a new view. Double-click or hit 'open'. Now, how to load that shapefile?

Ah, the menu bar has changed. Okay, let's hunt. Layer? No, not there. Shalom? Nope. File? Nope. Oh, it's under View then Add Layer. That's not a standard place for adding things. Usually the View menu is for stuff like zooming in and out. Oh well.
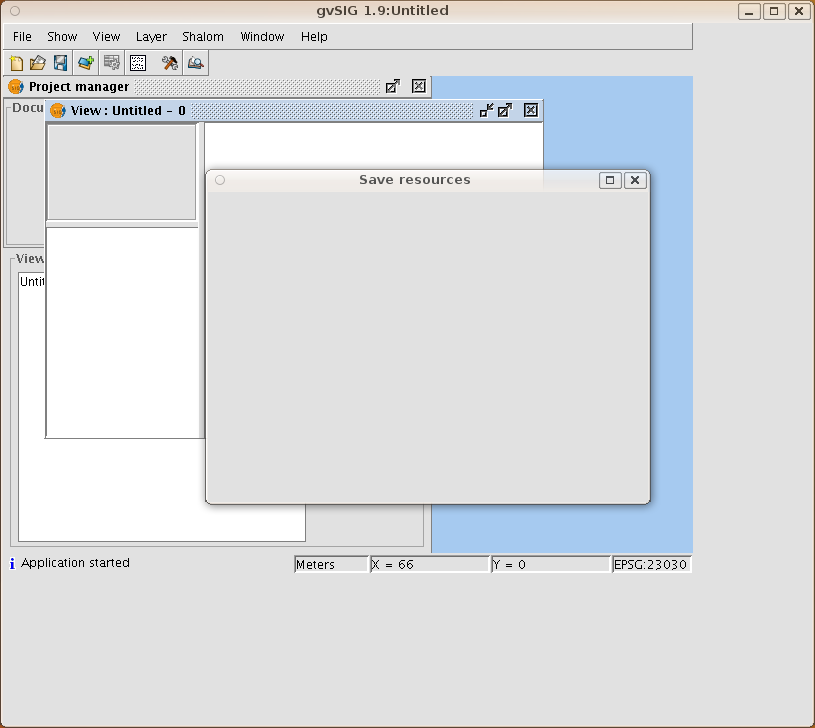
At least now I've got the option. Hit it!
Yeah. Blank. There's controls in there, since random clicking does things. But I see nothing. Oh well, let's quit and try something else:
Blank again. Most of the dialogs are blank, including Help. There's no obvious errors on the console either. I have to hit Ctrl-C to kill it.

Normally I blame these problems with java apps on JRE incompatibilities, but I have no idea what is going on here. I'm running on Ubuntu Karmic on a PC and everything else works nicely. Obviously something is messing up gvSIG since plenty of other people must be using it. Ideas welcome. I think my next step is to try it with a new clean username. But that shouldn't be necessary in this day and age...


Monday 3 May 2010

Medical Research Council grant success!

Back in October I talked about a grant proposal we'd put in to fund some research into disease surveillance. Well, a few weeks ago we heard that our application was successful! So that's nearly half a million pounds coming our way. It'll pay a large chunk of my salary for three years, a smaller chunk of the Prof, and a whole research associate. There's also money for new toys and travel to Africa, the USA and various conferences.

So if anyone with strong statistical skills in R is interested in a research project involving spatial and temporal statistics in epidemic prediction, get in touch and I'll send you some details. Probably starting in September.

Sunday 2 May 2010

Culture Colours and Infographics

A graphic from the Information Is Beautiful blog has been doing the rounds lately. I first saw it on Apartment Therapy and decided to have a little grumble about it. Then it got some coverage on the Junk Charts blog. I decided to get the raw data and see what it looked like in a more informative presentation.

But how to get the raw data? There's no link to it I could find. So I decided to scrape it.

First, I found the highest resolution image of it I could find on the web. Wasn't massive, but it would do. Then I could load it into R using readGDAL from the rgdal package:

co=readGDAL("image.png")
image(co,red=1,green=2,blue=3)

and there it is in my R graphics window. Now I need to generate a whole bunch of circular points where I want to sample the colours. So out with the sines and cosines. Lots of trial and error getting the radii right for all ten sections, but eventually I had it. It was a seconds work with the overlay function from the sp package to get the 860 colour points.

860? There's only 84 traits? I found and dropped the two rows that corresponded to the A-J index and the J-A index. Now I had all the colours in a nice matrix which I could save to a file for safe keeping.

For a simple presentation, I just created an HTML table where the cell background was the colour. It's hard to do rotated column headers in HTML, so I added a fixed DIVas index, and multiple row headers so you can always see the column heading letters. I think the resulting HTML page makes it much easier to navigate and find the colour for the thing you are looking for, although nobody will want to buy large-format version posters of it.


If anyone wants the raw data, drop me an email.